

|
Creating multiple PDF or EPS figures for overlayingfig2mpdf is an universal tool for creating figures to include either in PDF or in PostScript documents. Regardless the output type which is selectable by just one switch, the resulting document has exactely the size of the figure designed by xfig. In contrast to other tools fig2mpdf uses pdflatex in PDF mode for typesetting special texts of the figure so that the resulting documents never looks like the one shown in figure 1. But the most important feature of this tool is the capability to create multiple figures of one Fig file which might be overlayed in a presentation e.g created by the powerfull beamer package. Main features
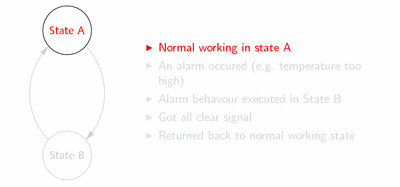
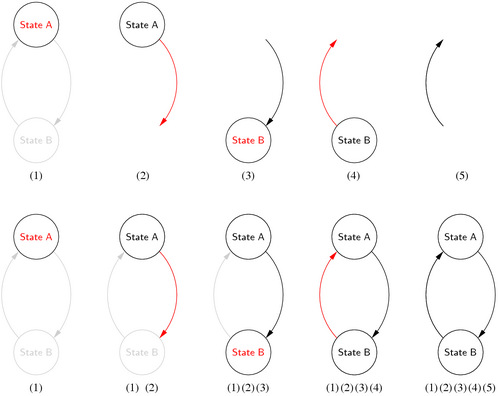
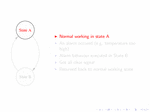
Overlay techniques for presentations with xfigAs mentioned in the projects overview page in these PowerPoint days it's really common to do beamer presentations instead of using the good old foil hardware. In contrast to PowerPoint presentations you can run PDF presentations, probably created with the beamer package and pdflatex, on nearly every computer of the world. With beamer presentations you can insert effects for example to lead the attention to a specific part of an figure e.g. if you are presenting a system in your figure and you are just talking about a part of this system. The pdflatex-beamer user has to produce a set of figures who are overlayed step by step by using the \multiinclude macro. Figure 2 shows a simple sample presentation.
xfig is one powerfull tool for creating figures. You can bind images of all types into your figures and there are all export filters you may ever need. But it's a hard work to build all necessary figure documents separately because they all have to have the same size and all items who occure in more than one document have to be placed identically to avoid any unwanted movements of these items. Furthermore it's nearly a misson impossible to maintain all these figures e.g. if you want to change a position of one element which is present in more than one figure file. fig2mpdf can do this work for you! The overlay figures are splited by the depths of their elements. Elements of consecutively used depths can be put into an own overlay document i.e. if there is a gap of at least one in the used depths this gap splits the figure (you can specify a maximum gap width which does not split the figure). Since xfig 3.2.4 you have the possibility to hide unwanted layers (depths) while editing the fig file. With this feature the production of overlay figures is really more comfortable. fig2mpdf examines the Fig file and gets a list of consecutive depths, I call ranges. If you want to define ranges by hand, you can do so. These ranges are atoms for the following operations. There are two main types of how the contents of the document files
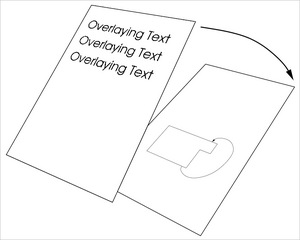
are assembled. Figure 3 depicts these two types as an example of a
figure with several ranges. Examine the Fig file and you will find the
following depths used: 53, 52, 50, 49, 46, 45, 44, 41, 40, 38, 37. This
usage result into the five ranges: (1) 53, 52 (2) 50, 49
(3) 46, 45, 44 (4) 41, 40
and (5) 38, 37.
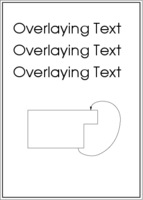
If the overlayed figure has a transparent background as shown in figure 3 you can add some new elements in the next displayed range. But if you want to change an already displayed part of the figure (like the red arrows in the example) you have to put a frameless opaque square or whatsoever onto the part and place some new elements on top of it if desired. For further information about the capabilities of the tool I refer to the man page of fig2mpdf which is part of the package. Using LaTeX for typesetting the figure textsThere are many reasons for using LaTeX for typesetting your articles or even books --- compatibility, reusability and complex formulars to mention just three of them. Once the decision is taken to use LaTeX you might or probably should want to have the same typesetting in your figures. This is for having exactly the same symbols in the text an the figures or you might want to have some formulars in your figures. To achieve this you have to set the special flag of these texts LaTeX should typeset (normally all texts but keep in mind that this flag isn't set by default) and select the right output languages of fig2dev. Figure 4 shows how the procedure works. The first driver (pstex) creates an EPS file containing everything which can be done by the fig2dev itself e.g. rectangles, circles, etc. The second export with pstex_t creates a body of a LaTeX document which includes the just mentioned eps graphics file. This eps document is included in that way that all LaTeX texts are put on top of it. Because of this isn't allways usefull, i.e. if you have overlayed texts in the figure, I have created the two drivers pstex_p and pdftex_p who are used by fig2mpdf.
Examples
|
||||||||||||||||||||||||||||||||||||||||||||||||||||||||||||||||||||||||||||||||||||
| |||||||||||||||||||||
|
|